A whole generation of economics and business students are trained to expect higher returns from small stocks (low market cap), alongside low-priced value stocks and a good recent return history (momentum). Such was the case when factors became a standard part of the curriculum some thirty years ago, and to the best of my knowledge, this is still the case. They just extended the menu.
The problem is reality. While the combination of small size and low pricing was especially profitable for many years, the last decade or so has seen a complete turnaround.
It is common knowledge that a major share of index returns in the US can be ascribed to a handful of large, high-priced companies with the fairly recent moniker “The Magnificent Seven” encompassing Apple, Microsoft, Amazon, Google, Nvidia, Tesla, and Meta (Facebook). As these companies obviously get a negative score on the dimension small size, a portfolio of such companies will appear to be even better when adjusting performance for this factor. That’s how many people will be trained to uncover just how good the performance really is.
But why make a deduction for a factor that no longer yields excess returns?
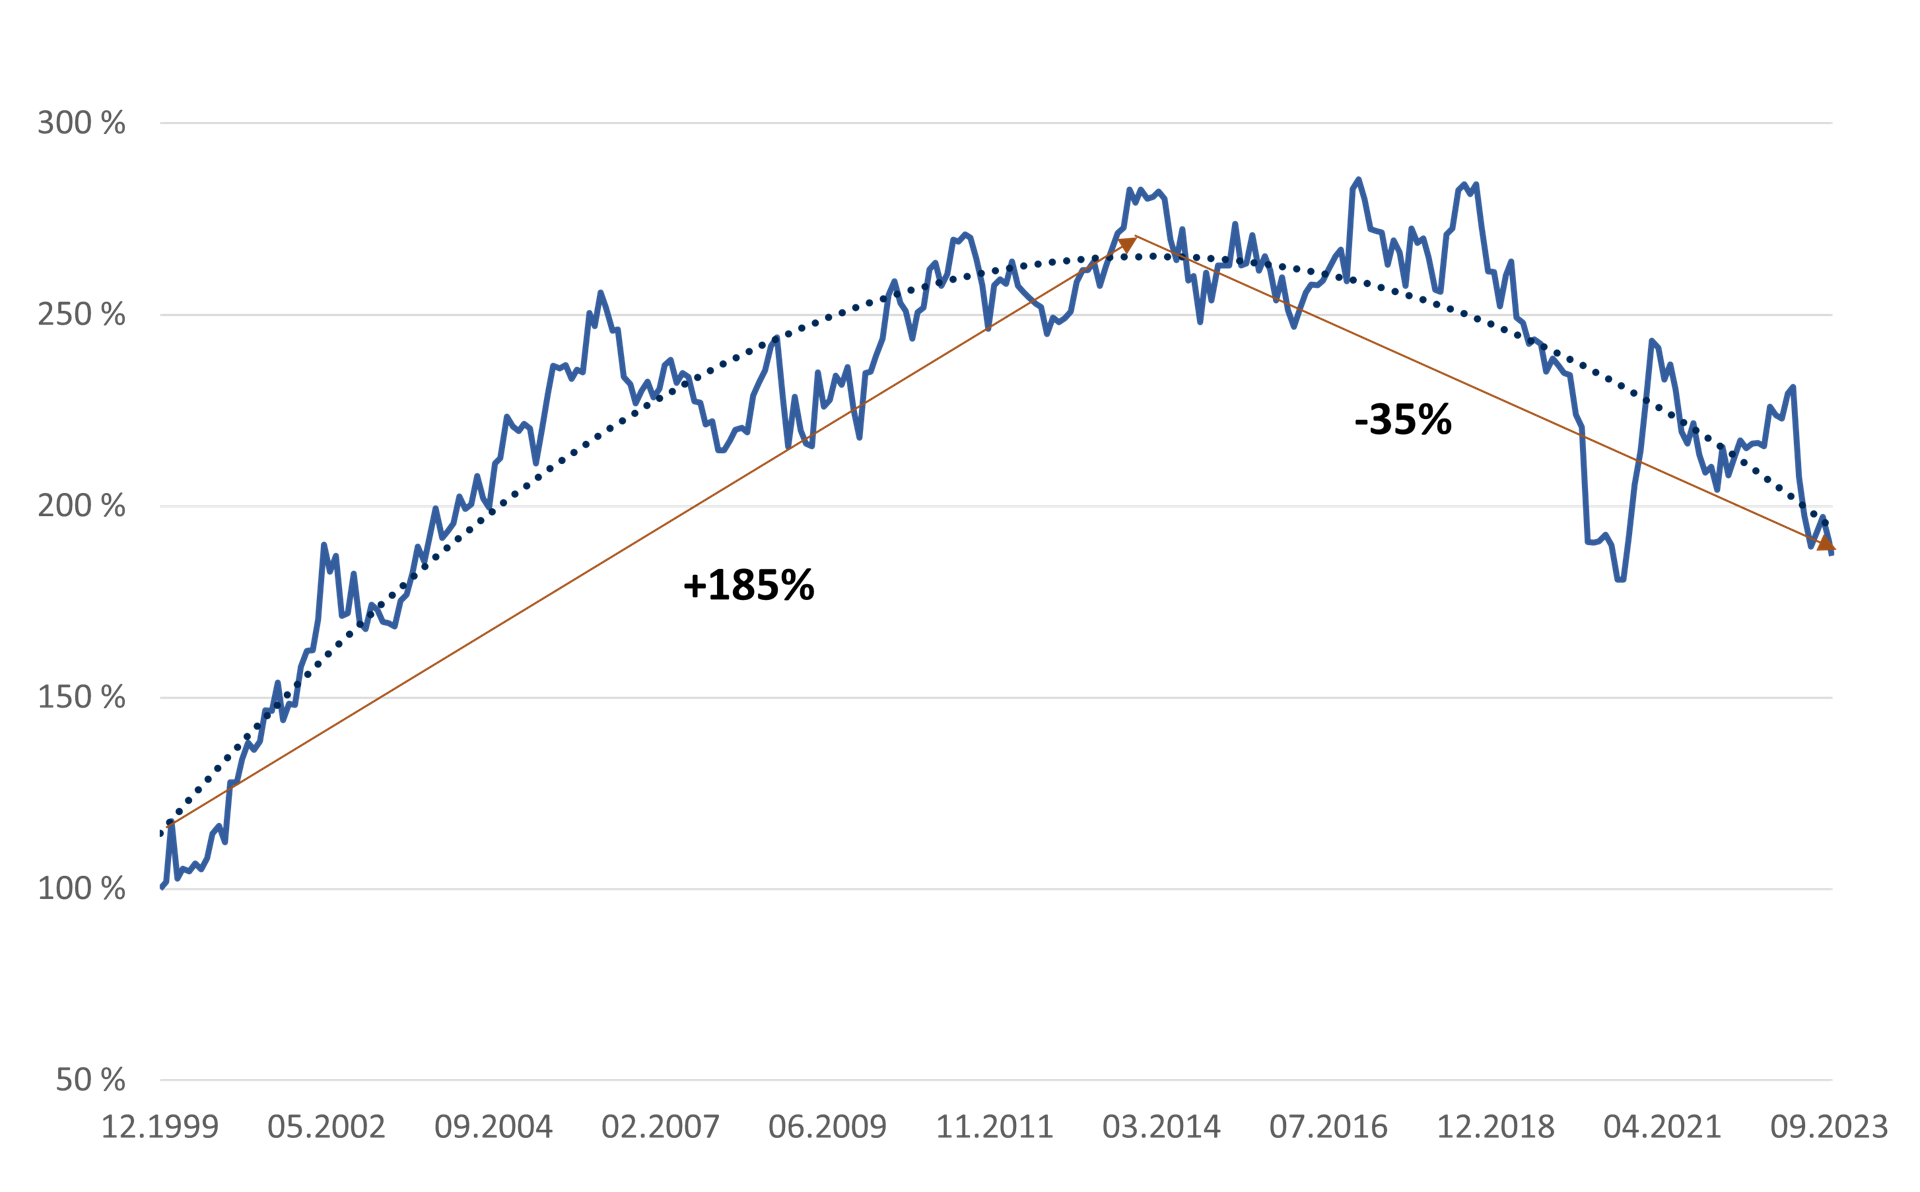
For a long time, it did. If, at the outset of this millennium, we had invested an equal amount in the S&P 100 (large cap) and the S&P Small Cap 600 (self-explanatory), the value of the small-cap part would have reached almost three times the large-cap value some ten years ago. That’s excess return for you! Riding such a wave did not require true skill.
Today, this relationship is truly turned on its head. A similarly paired investment ten years ago would have seen the small caps end up 35% lower than the narrow large-cap leg. If instead we use S&P 500 as a large-cap gauge, the difference is somewhat lower – but still a noticeable 30%.
Small size effect in reverse
Such is the case in Norway too – only even more pronounced. Here, the small-cap advantage peaked already in November 2008, in the middle of the Great Financial Crisis. Over the ensuing 15 years, small caps lost a full 62% relative to the benchmark index.
Too many numbers? Here’s a simpler conclusion: Over the past 10-15 years, large stocks have outperformed small stocks by a considerable margin – with the opposite sign of the textbooks. Even if research tends to measure this factor somewhat differently, there, too, this classical effect is getting erased. Index figures covering most of the market make it evident that they are not only erased; they’re also switching sign.
“Over the past 10-15 years, large stocks have outperformed small stocks by a considerable margin – with the opposite sign of the textbooks. ”
Part of the explanation may be that the small stock effect was exhausted after three decades as an established truth, or perhaps we should look at capital flows into indexed instruments focused on large caps. On closer thought, I’ll leave this to research …
The disappearing small stock effect is an eminent illustration of a weakness in the many research contributions on the so-called factor zoo: They implicitly presume that one or more aspects of the past will repeat themselves (yes, with so-called out-of-sample testing too). Otherwise, it cannot be claimed to be a fundamental market characteristic, as opposed to a possibly random or period-specific pattern.
Some still insist on talking about risk factors. For small stocks, risk may certainly have been an apt term, but then you will struggle to explain the excess return from large stocks. As to value stocks vs. growth stocks, it is interesting to note little research, if any at all, distinguishes between company risk and pricing risk. Companies in trouble may be had for nickels and dimes – but the downside risk may be just as large in high-priced adventures of the most impressive kind. The highest priced stocks also have higher than average volatility, so claiming they represent “lower risk” is a bit of a stretch.
It's been known to happen, though.