In December 1996, Alan Greenspan, then US Fed chairman, held a speech in which he suggested that asset prices could be inflated by irrational exuberance. In subsequent years, this came close to being a synonym for exaggerated optimism.
Here’s a perhaps fascinating coincidence: At the very same time, the US Federal Reserve started collecting data for equity issuance in US non-financial companies – and for negative issuance in the form of share buybacks and mergers and acquisitions paid in cash. Those figures truly deserve a closer look.
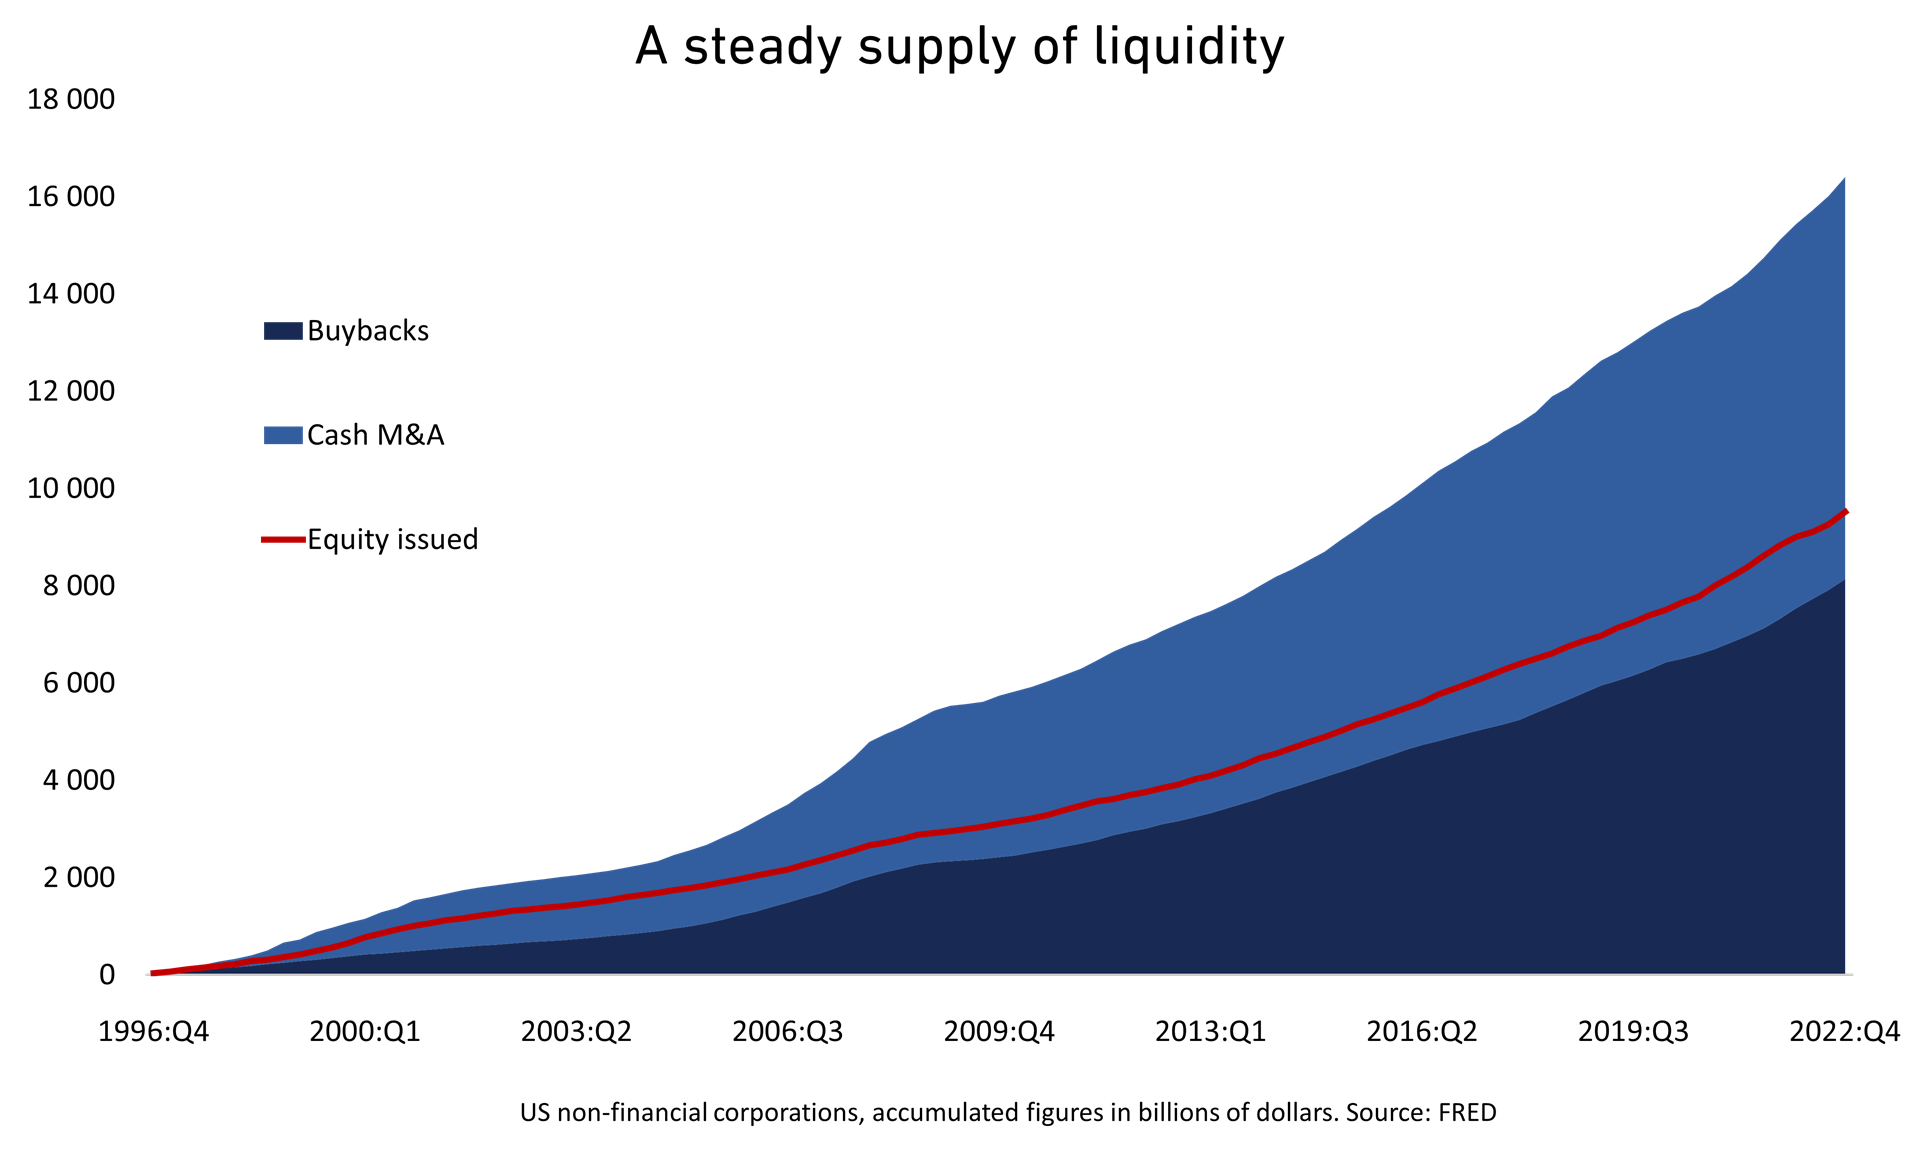
As you would expect, major amounts of dollars are injected into US companies. For non-financial corporations, annual issuance has risen from $155 billion to an average of more than $740 billion over the past two years. Despite recession warnings piling up, the last quarter of 2022 saw record issuance of close to $260 billion. In total, more than $9,500 billion has been raised since the fourth quarter of 1996.
Hiding in the data, however, is something of a surprise: Net issuance is negative. And the gap keeps growing.
Yes, buybacks are an important part of the equation. Since the fourth quarter of 1996, aggregated buybacks amount to more than $8,100 billion. The figure has doubled during the past nine years.
Slightly more equity has been retired through mergers and acqusitions, however. This adds up to a total of almost $8,300 billion. Please note that only the cash part of the transaction paid by US acquirers is included in this figure.
Do the math and you’ll find that distributions exceed issuance by almost $6,900 billion. More equity is retired than issued.
In case you wondered, dividends are not included. They add up to almost twice as much: $12,260 billion. In total, then, a net amount of more than $19,100 billion has been distributed to shareholders in US companies. This includes both listed and unlisted companies, but the former represent a large part of these payments.
To put this figure into perspective, it represents roughly 5% of US GDP or 27% of real gross private investment according to the national accounts. I gladly admit that comparing a snapshot figure with a sum accumulated over more than 26 years is wildly misleading, but this is too tempting: The accumulated supply of liquidity corresponds to about 35% of the total market cap of the US stock market.
Either way, it represents a massive injection of liquidity that is bound to have influenced the dominant US stock market. You’d be excused for guessing that it might even have influenced other stock markets.
Part of the explanation is obviously higher profit margins, which have risen far above levels seen in previous decades. This may be due to, say, higher market concentration, less powerful labour unions, or perhaps a lower cost of capital. Negative net issuance supports the latter explanation. Given recent interest rate developments, that’s a pertinent reminder: it may not continue this way indefinitely.
For now, though, estimates point to continued earnings strength.