Modern finance, no longer that modern, is built on an idea that there is a risk-free rate of return. If you want an even higher return, you must take on some risk. You may then scale expected return and risk as you desire with different combinations of the risk-free return and the stock market return.
Sounds great, right? What exactly, though, is the risk-free return?
In the last annual survey by PwC and the Finance Society Norway, half the respondents listed the yield on 10-year government bonds as their preferred choice of risk-free return (or rather source thereof). Similarly, long US Treasuries are often used in valuation exercises. And well-respected contributions on the empirical excess return in the stock market from, say, 1871 or 1900 measure the excess return as the return in excess of the return you could have had on government bonds.
A risk-free bond, as a theoretical construct, provides absolute certainty that you will be repaid both principal and interest. To be more precise: Absence of risk is defined as absence of credit risk.
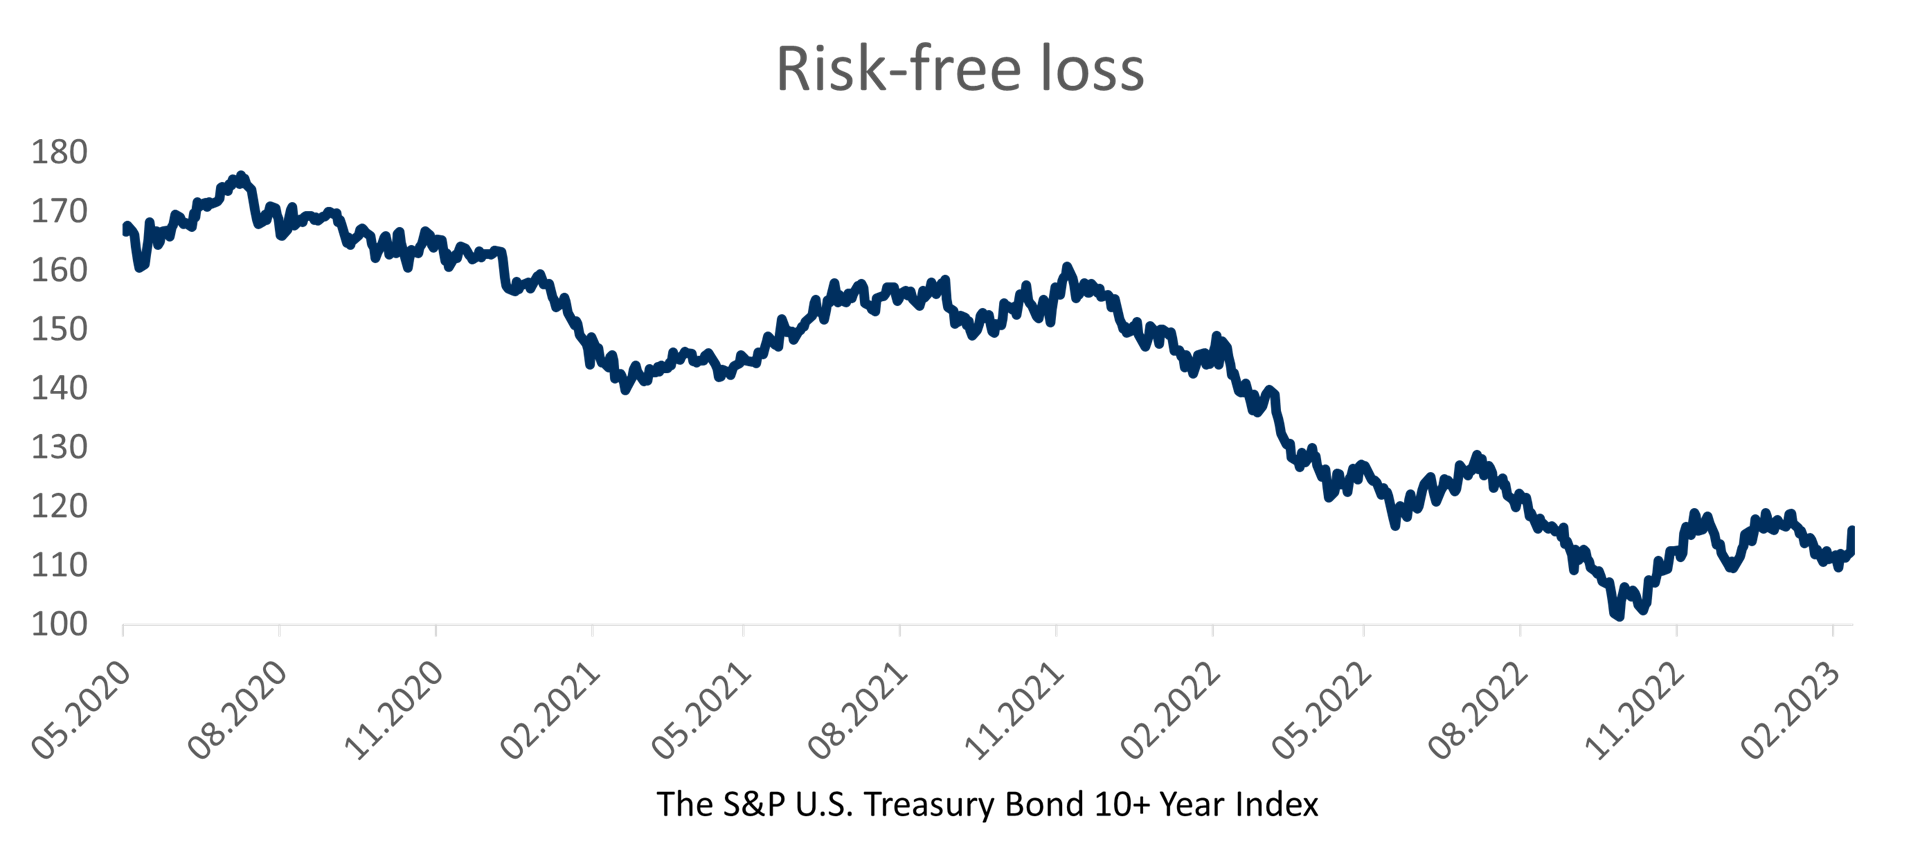
Enter interest rate risk. Constituents in the S&P U.S. Treasury Bond 10+ Year Index are long US governments bond with credit risk hardly worth mentioning, despite another federal debt ceiling fight coming up. The interest rate risk is another matter: If, at the start of August 2020, you had invested $100 in this index, you would now be down more than $34. If you had waited until the start of 2022, you would still be $25 in the red.

Yes, you can secure your investment by matching the timeline of the bonds in question. If it is due in October 2027, you can pretty much rest assured that you will get the rest of your money back in October 2027. This has, however, no practical bearing whatsoever on a stock portfolio. A stock investor can’t build a portfolio on matching bond duration and stocks. That’s not how the stock market works. It is technically impossible to scale expected return and risk according to your own whims.
The problem is that fluctuation risk, a finance favourite because it is so easy to measure, is formidable. And that’s not just hindsight after a period of rising interest rates. Over the past 10 years, this bond index has an average annualised 12-month volatility of 12.6%, as compared to 15.6% in the obviously risky stock index S&P 500. If we stop counting before the pandemic shock in the spring of 2020, the difference is reduced to 1.6 percentage points, whereas using the median reduces the difference even further, to 1.4 percentage points regardless of period.
“In other words: In terms of volatility, i.e. the standard deviation, long US governments bonds are almost as risky as US stocks.”
Of course, criticizing professional orthodoxy built on far-fetched assumptions is always a rewarding exercise. However, there is also a practical aspect. I have reason to believe that many of you have been advised to invest a good chunk of your institution’s money in long US (or European) government bonds precisely for the purpose of limiting risk. Did anyone spell out the risk of these investments fluctuating like, well, an excessively hot place with no snowballs?

