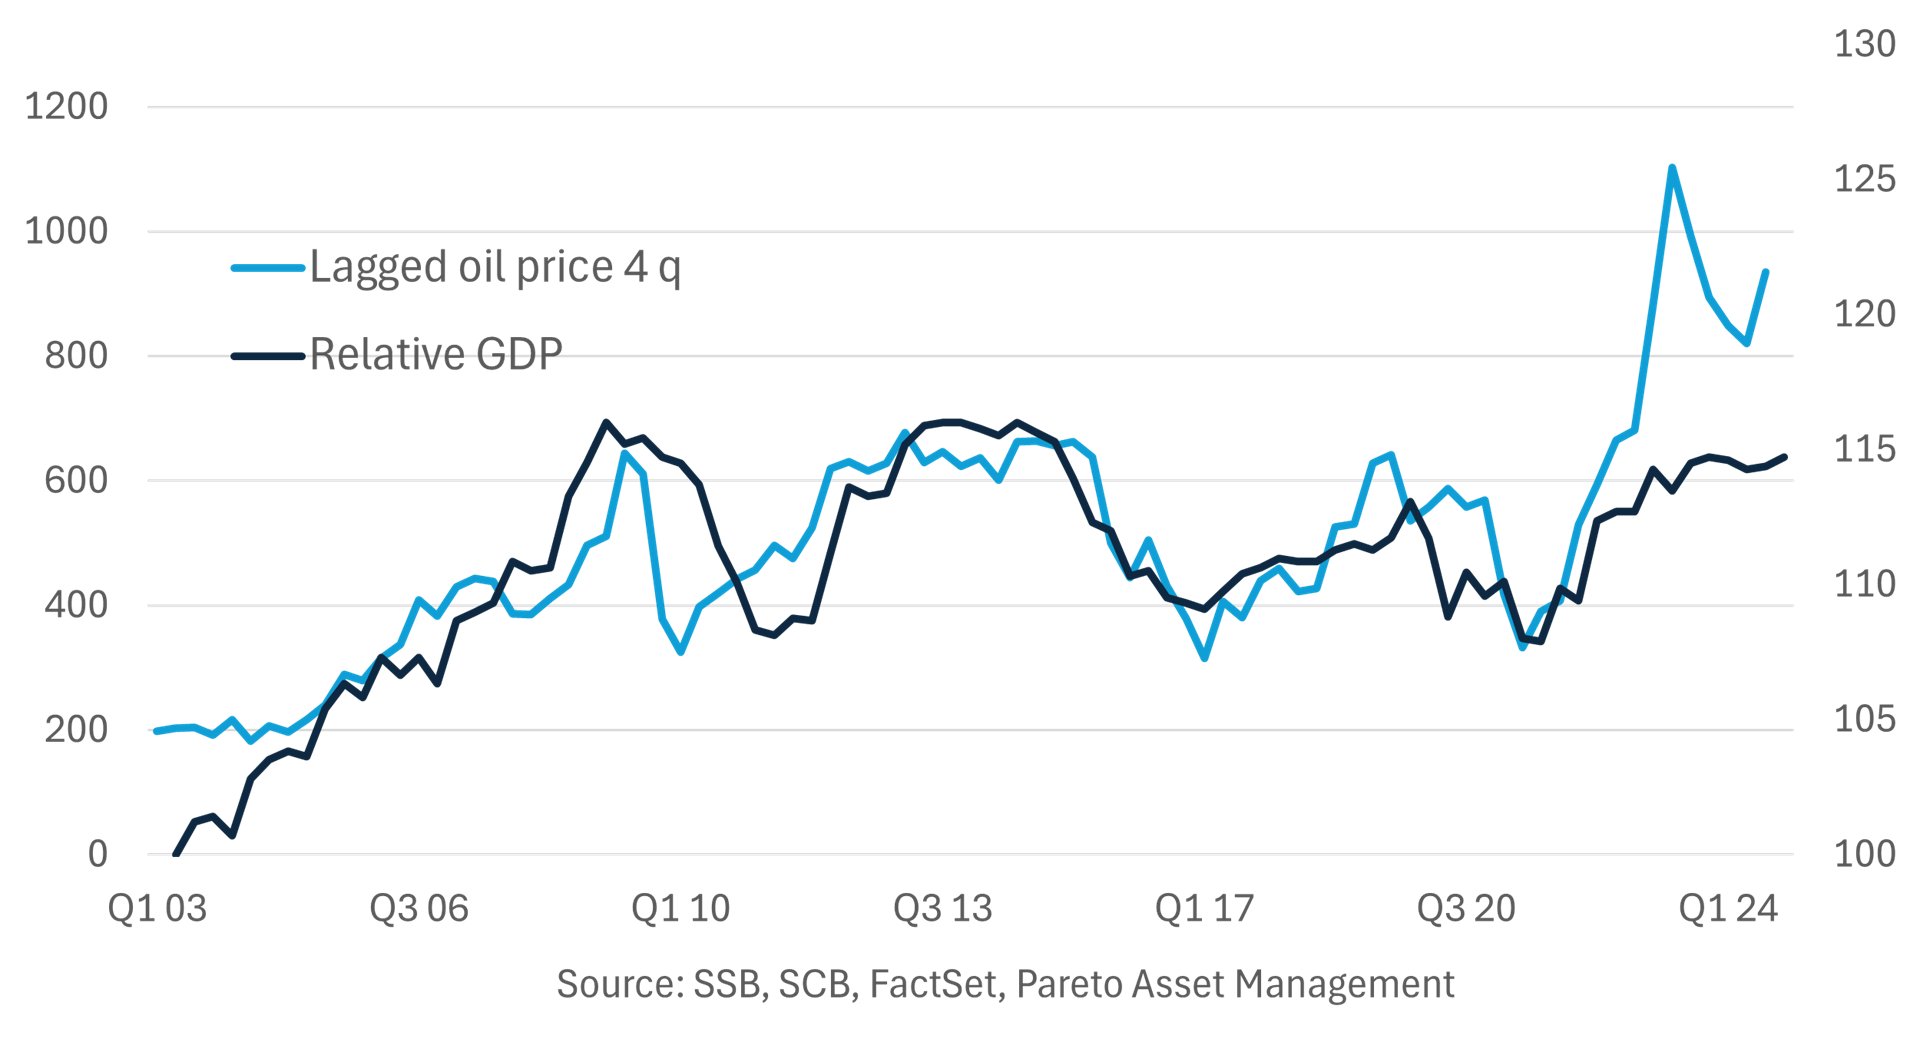
This question has resurfaced: Are we underestimating the impact of the petroleum sector on the Norwegian mainland economy? I’m inclined to answer in the affirmative, and I’d like to illustrate my point with a graph I created more than ten years ago – before the sharp drop in oil prices from the summer of 2014. The graph tells the same story now.
A starting point can be last year’s government report on long-term economic perspectives. According to this report, demand from the petroleum sector was equivalent to roughly nine per cent of mainland GDP last year. For the mainland economy, then, the North Sea is a slightly larger export market than the entire Nordic region, based on total exports of goods and services. This of course is just the immediate demand.
I don’t know of attempts to quantify differences in multiplier effects, but pricing towards a sector with fluctuating resource rents logically has a greater impact on value than on volume, which is what we measure in the national accounts. We have seen for years that some of the resource rent flows to the supplier industry – through the cost level on the Norwegian continental shelf. Profitability is generally conducive to technological development and productivity growth, and I doubt this industry is an exception.
In 2014, demand from the petroleum industry was equivalent to more than 13 per cent of the mainland economy. By this measure, the impulse from the petroleum industry has been reduced by about one third in ten years. Conversely, it surged even more in the decade leading up to 2014. The North Sea, in short, is a volatile market.
To illustrate these fluctuations, I have compared the mainland economy with neighbouring Sweden. I have done this by creating an index that shows the relative development of mainland GDP to Swedish GDP on a quarterly basis. Somewhat simplified, these economies are exposed to the same international business cycles – except for the uniquely Norwegian impulses from the petroleum sector. To the extent that the two economies develop differently, the North Sea is an obvious factor to credit or blame.
Mainland oil price effect?

The level is unimportant here. The point is to highlight the fluctuations. We see that relative growth follows the oil price quite closely (correlation close to 0.8). The oil price is measured in Norwegian kroner, but it makes little difference if we use the dollar price or remove government GDP from the comparison. Since it takes time for changes in the oil price to have an impact, I’ve used a four-quarter lag. Consequently, the spike at the right end refers to the second quarter of 2022, when both oil and gas were boosted by the invasion of Ukraine. Demand from the petroleum industry fell that year, despite the price jump. Up until then, correlation was above 0.8.
Of course, Norway has had greater financial muscles to smooth the business cycle, or perhaps to boost trend growth over time, by using steadily more oil money. But neither level nor trend is of interest here. The simple point is that the mainland economy’s relative development varies with the oil price.
You’d be hard pressed to argue that this has nothing to do with the petroleum business.

