Dances with oil
The Optimal Pareto
09.03.2025
See how the Norwegian mainland economy develops in tune with the price of oil.
See how the Norwegian mainland economy develops in tune with the price of oil.
This question has resurfaced: Are we underestimating the impact of the petroleum sector on the Norwegian mainland economy? I’m inclined to answer in the affirmative, and I’d like to illustrate my point with a graph I created more than ten years ago – before the sharp drop in oil prices from the summer of 2014. The graph tells the same story now.
A starting point can be last year’s government report on long-term economic perspectives. According to this report, demand from the petroleum sector was equivalent to roughly nine per cent of mainland GDP last year. For the mainland economy, then, the North Sea is a slightly larger export market than the entire Nordic region, based on total exports of goods and services. This of course is just the immediate demand.
I don’t know of attempts to quantify differences in multiplier effects, but pricing towards a sector with fluctuating resource rents logically has a greater impact on value than on volume, which is what we measure in the national accounts. We have seen for years that some of the resource rent flows to the supplier industry – through the cost level on the Norwegian continental shelf. Profitability is generally conducive to technological development and productivity growth, and I doubt this industry is an exception.
In 2014, demand from the petroleum industry was equivalent to more than 13 per cent of the mainland economy. By this measure, the impulse from the petroleum industry has been reduced by about one third in ten years. Conversely, it surged even more in the decade leading up to 2014. The North Sea, in short, is a volatile market.
To illustrate these fluctuations, I have compared the mainland economy with neighbouring Sweden. I have done this by creating an index that shows the relative development of mainland GDP to Swedish GDP on a quarterly basis. Somewhat simplified, these economies are exposed to the same international business cycles – except for the uniquely Norwegian impulses from the petroleum sector. To the extent that the two economies develop differently, the North Sea is an obvious factor to credit or blame.
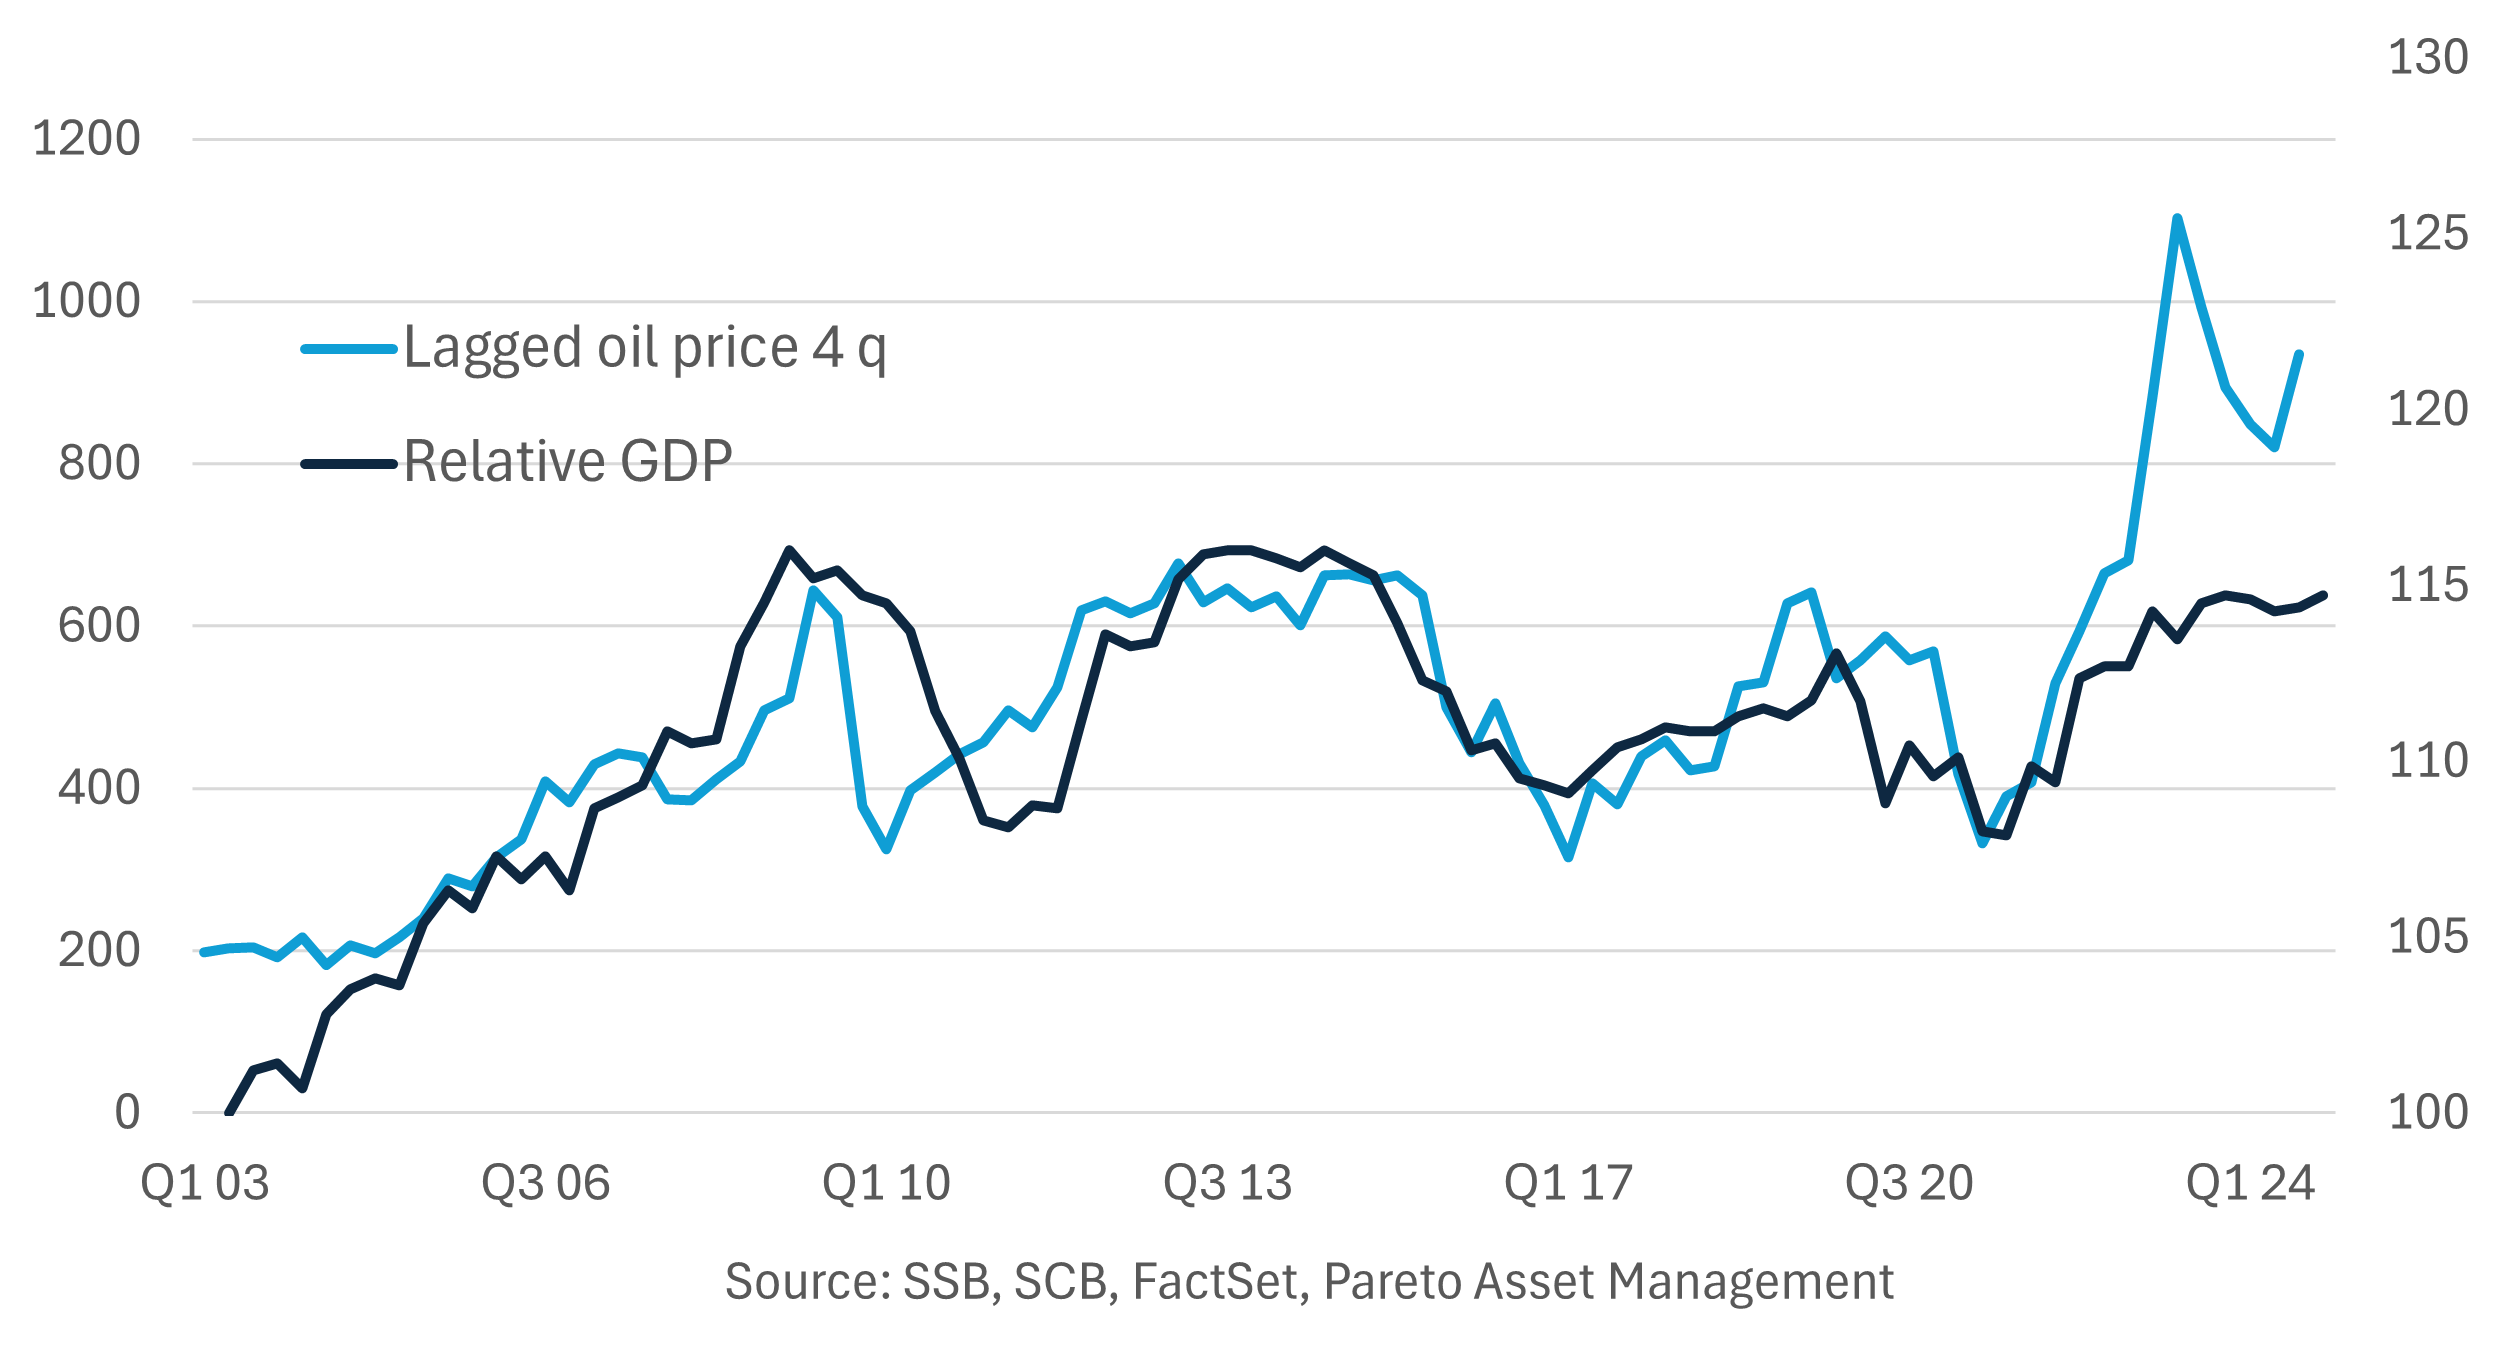
The level is unimportant here. The point is to highlight the fluctuations. We see that relative growth follows the oil price quite closely (correlation close to 0.8). The oil price is measured in Norwegian kroner, but it makes little difference if we use the dollar price or remove government GDP from the comparison. Since it takes time for changes in the oil price to have an impact, I’ve used a four-quarter lag. Consequently, the spike at the right end refers to the second quarter of 2022, when both oil and gas were boosted by the invasion of Ukraine. Demand from the petroleum industry fell that year, despite the price jump. Up until then, correlation was above 0.8.
Of course, Norway has had greater financial muscles to smooth the business cycle, or perhaps to boost trend growth over time, by using steadily more oil money. But neither level nor trend is of interest here. The simple point is that the mainland economy’s relative development varies with the oil price.
You’d be hard pressed to argue that this has nothing to do with the petroleum business.
Capital flows affect stock prices. This basic proposition aligns poorly with conventional wisdom in finance. It’s also easy to dismiss – after all, for every buyer there is a seller, right? Duh!
As it happens, though, this is the subject of a growing number of interesting research efforts. They revolve around the perhaps somewhat nebulous concept of stock market elasticity.
In basic economics, we talk about price elasticity. If a price rise of 1% lowers the volume of goods sold by 5%, demand is highly elastic – meaning it is very sensitive to changes in price.
In finance, the concept is somehow turned on its head: We want to know the sensitivity of the stock price to changes in capital invested in the stock market through mutual funds, pension funds etc. If the market is elastic, it can absorb this supply of capital without really changing the price. Given a price elasticity of 5 (or, conversely, a multiplier of just 0.2), an inflow of 5% would only increase the price level by 1%.
In standard models, the market is even more elastic. When prices rise, more investors find stocks expensive, and decide to sell. We’re taught that stock market returns are a function of the risk-free rate and a perhaps inexplicably high risk premium. Capital flows don’t enter into it. There’s perfect competition and a given price in a perfect market.
Not so in real life.
This acute insight has started to make inroads into financial research too. Here’s the crux: What if investors don’t find the new price level expensive? What if they actually don’t care about the price?
This is the case for investors with a fixed mandate, most notably passive investors like index funds. If they have an inflow of a billion dollars, this capital must be invested in the index. If that makes prices rise, so be it.
And they certainly do. According to research now gaining traction in the financial community, the stock market is highly inelastic: 1 dollar invested in the stock market makes the aggregate market value rise by as much as 5 dollars (a multiplier of 5). The rising share of passive investment means that fewer investors now find the new price level too high. There are simply more investors for whom the price level is irrelevant.
See the implications?
I dare say it’s getting harder and harder to explain why conventional wisdom fails to explain such features of the stock market.
About the author

Finn Øystein Bergh joined Pareto in 2010, the first years in Pareto AS before joining Pareto Asset Management in 2015. He has previous experience as a journalist, chief economist and later managing editor in the financial magazine Kapital. Finn Øystein Bergh holds an MSc in Economics and Business Administration, MBA, cand. polit. (an extended master's degree) in political science and cand.polit. in economics. He writes the financial blog Paretos optimale, and has published several books on economics.