All-time fluff
The Optimal Pareto
16.03.2026
The MSCI World Index has reached a new all-time high eight times this year. This tells us that … it has reached a new all-time high eight times this year.
The MSCI World Index has reached a new all-time high eight times this year. This tells us that … it has reached a new all-time high eight times this year.
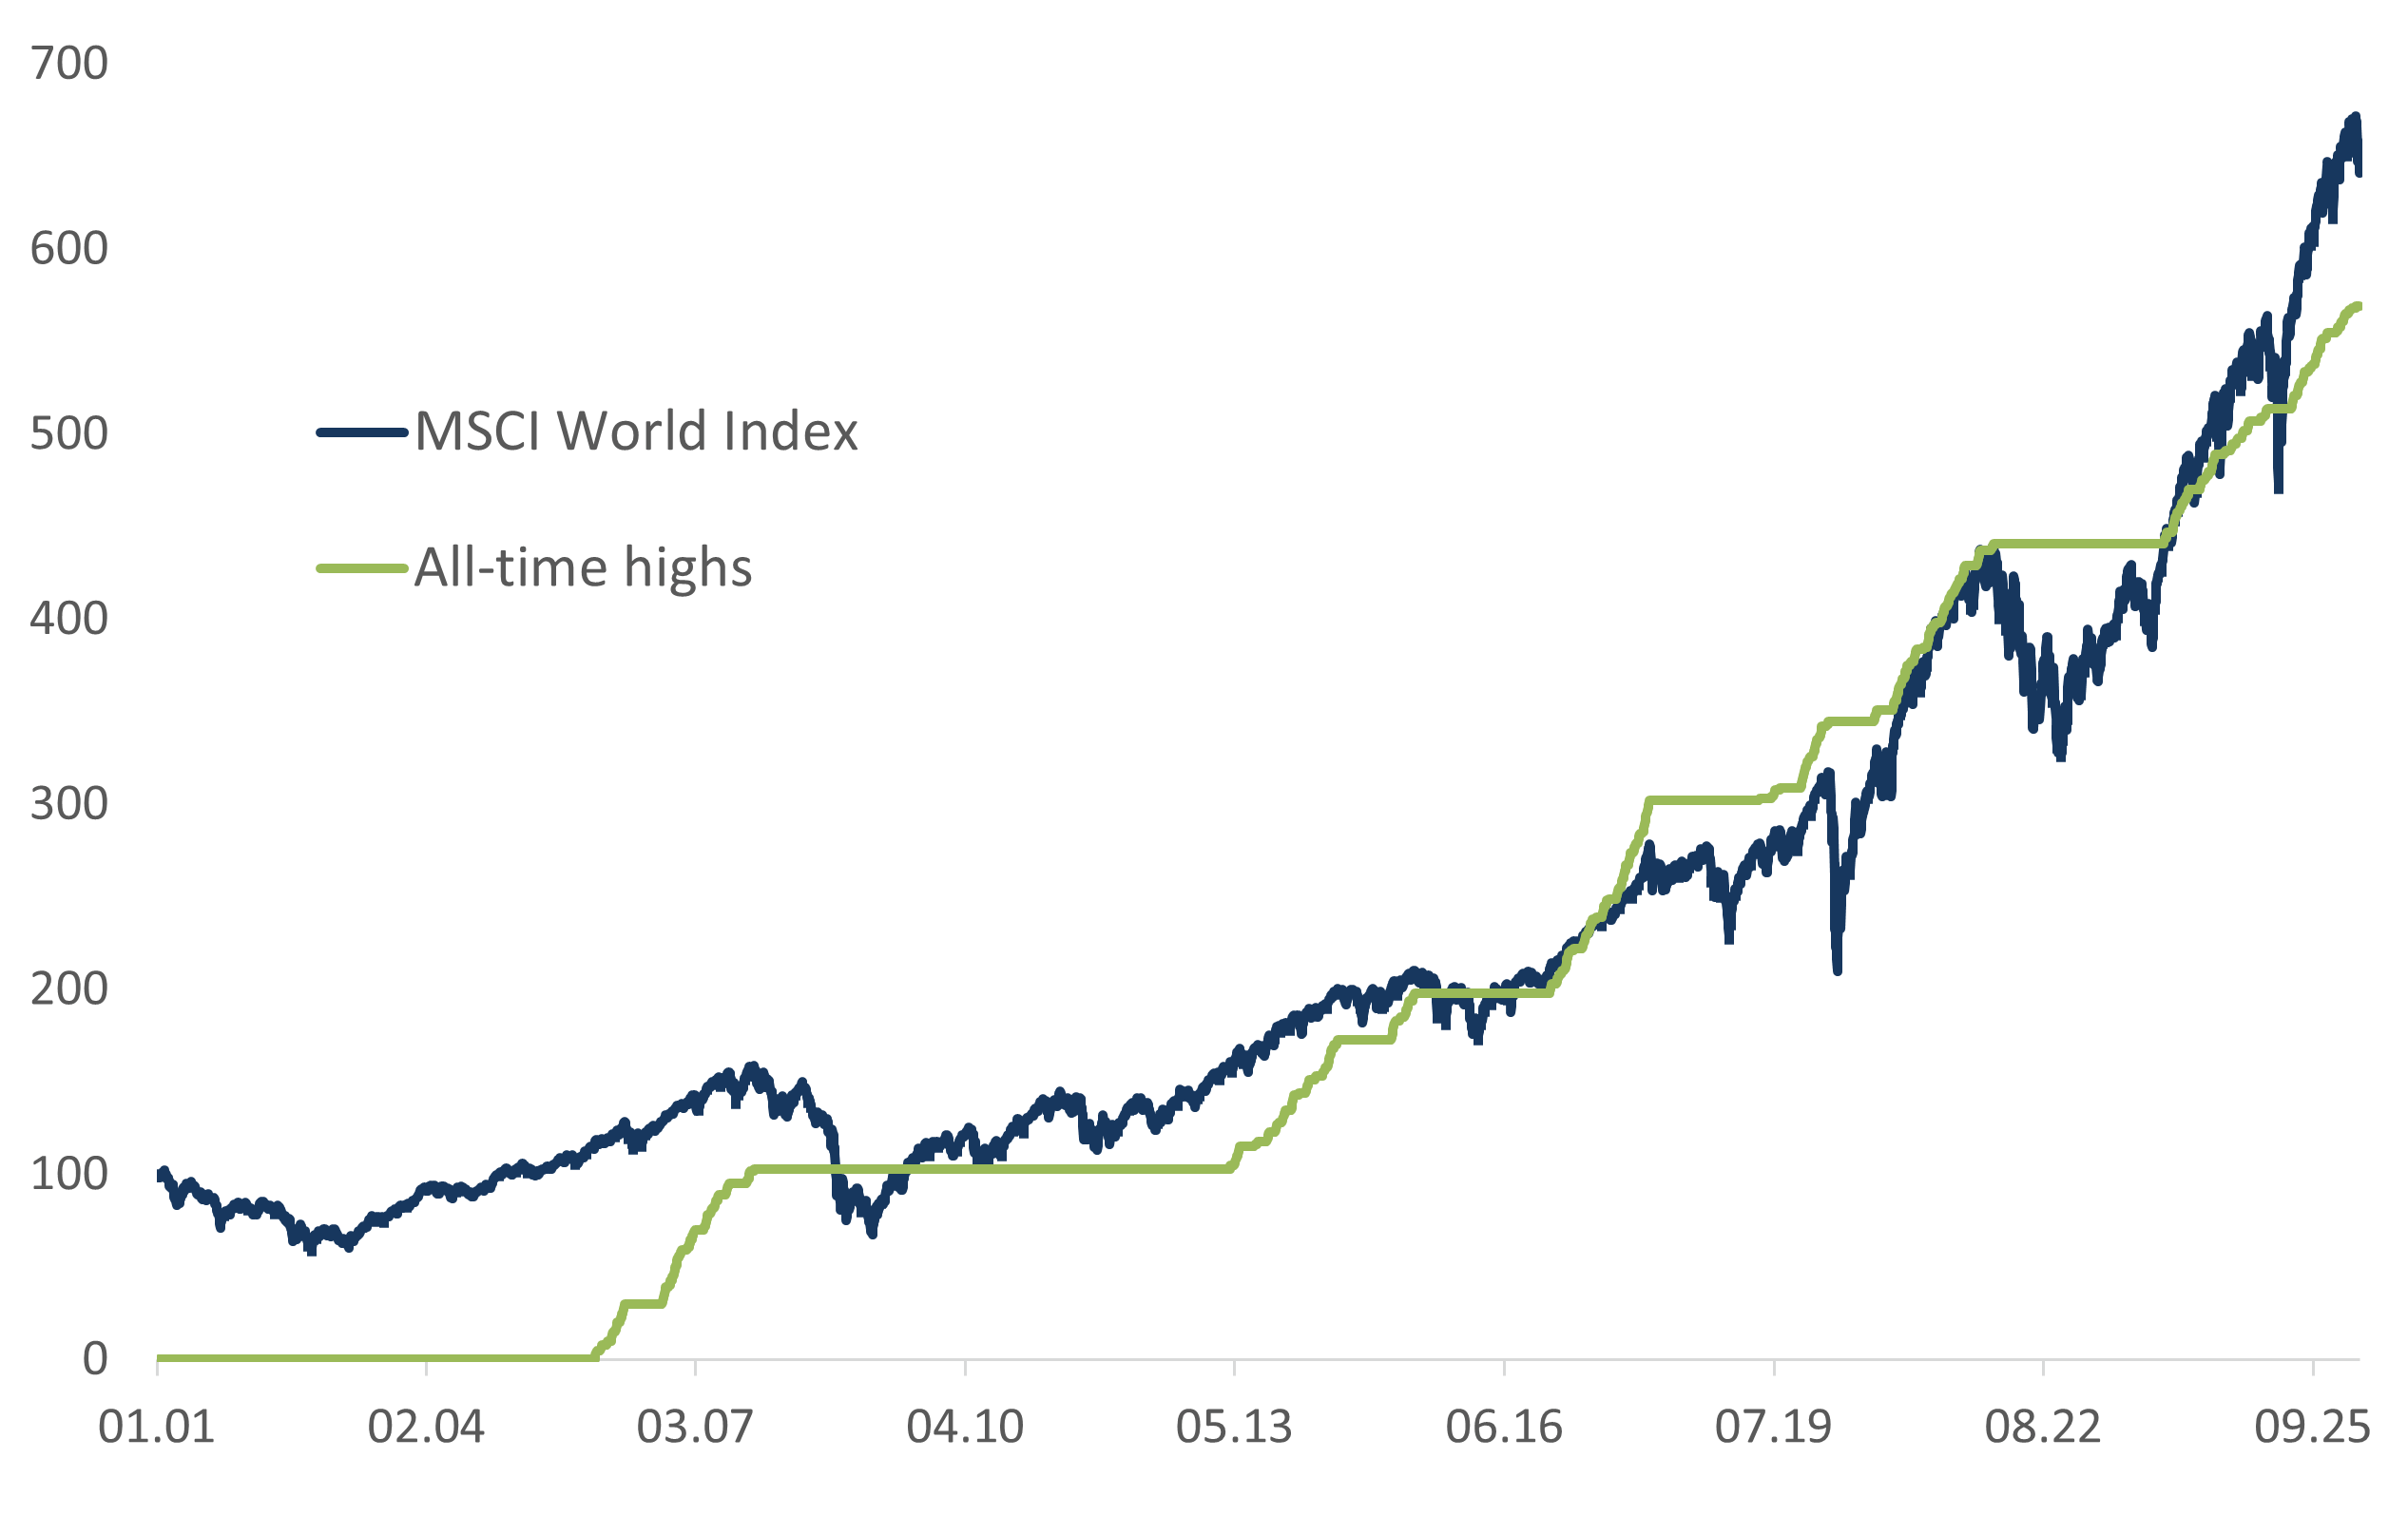
New all-time highs don’t tend to go unnoticed. After all, each occurrence marks some kind of new record. However, it is not something our clients tend to applaud. For them, it is rather a source of concern and worry. With the market having climbed higher than ever, the potential for a major decline has surely increased, right?
Since December 2000, the MSCI World Index has notched up a total of 569 new all-time highs, eight of them since the start of this year. If you haven’t seen this figure before, it’s probably because I’ve used a total return version of the index, not the headline figure without reinvested dividends. Either way, the sheer number of all-time highs seems to be the basis for a lot of client apprehension.
To be perfectly clear: A new all-time high has absolutely no informational value. It doesn't really tell you anything besides the fact that the index has not seen this number before. That’s what I call data, not information.
Everyone nowadays is used to adjusting historical numbers for inflation. If we had adjusted the stock market history for inflation, we would have gotten far fewer all-time highs. But why stop at adjusting for inflation?
The basic logical error here is imagining that the stock market is something that just goes up and down. In reality it goes a lot more up than down; the market oscillates around a rising trend line, not a flat line. This means that it inevitably produces an infinite number of new all-time highs. One might argue, then, that we ought to make an adjustment for this trend return. If so, a new all-time high would signify that the index had never before been this much above its own trend return.
This is not feasible in practice, inasmuch as the trend itself is critically dependent on recent quotes. It does, however, demonstrate the logical impossibility of evaluating the stock market on the basis of the latest step in an infinite ladder.
The funny thing is that many people associate a string of all-time highs with high market risk. There has been a lot of market movements and now it’s moved to yet another top, something like that. But this is wrong by 180 degrees. The thing is that frequent all-time highs signify lower, not higher, risk. Just think of a standard bank savings account – which hits a new all-time high every single day!
In this case, however, the daily return can best be described as microscopic. If you’re lucky enough to be rewarded with a 3% return on your account, your daily return works out to some 0.008%. And remember that we’re talking about 3% before tax and inflation.
You don’t find that a lot scarier?
About the author

Finn Øystein Bergh joined Pareto in 2010, the first years in Pareto AS before joining Pareto Asset Management in 2015. He has previous experience as a journalist, chief economist and later managing editor in the financial magazine Kapital. Finn Øystein Bergh holds an MSc in Economics and Business Administration, MBA, cand. polit. (an extended master's degree) in political science and cand.polit. in economics. He writes the financial blog Paretos optimale, and has published several books on economics.